
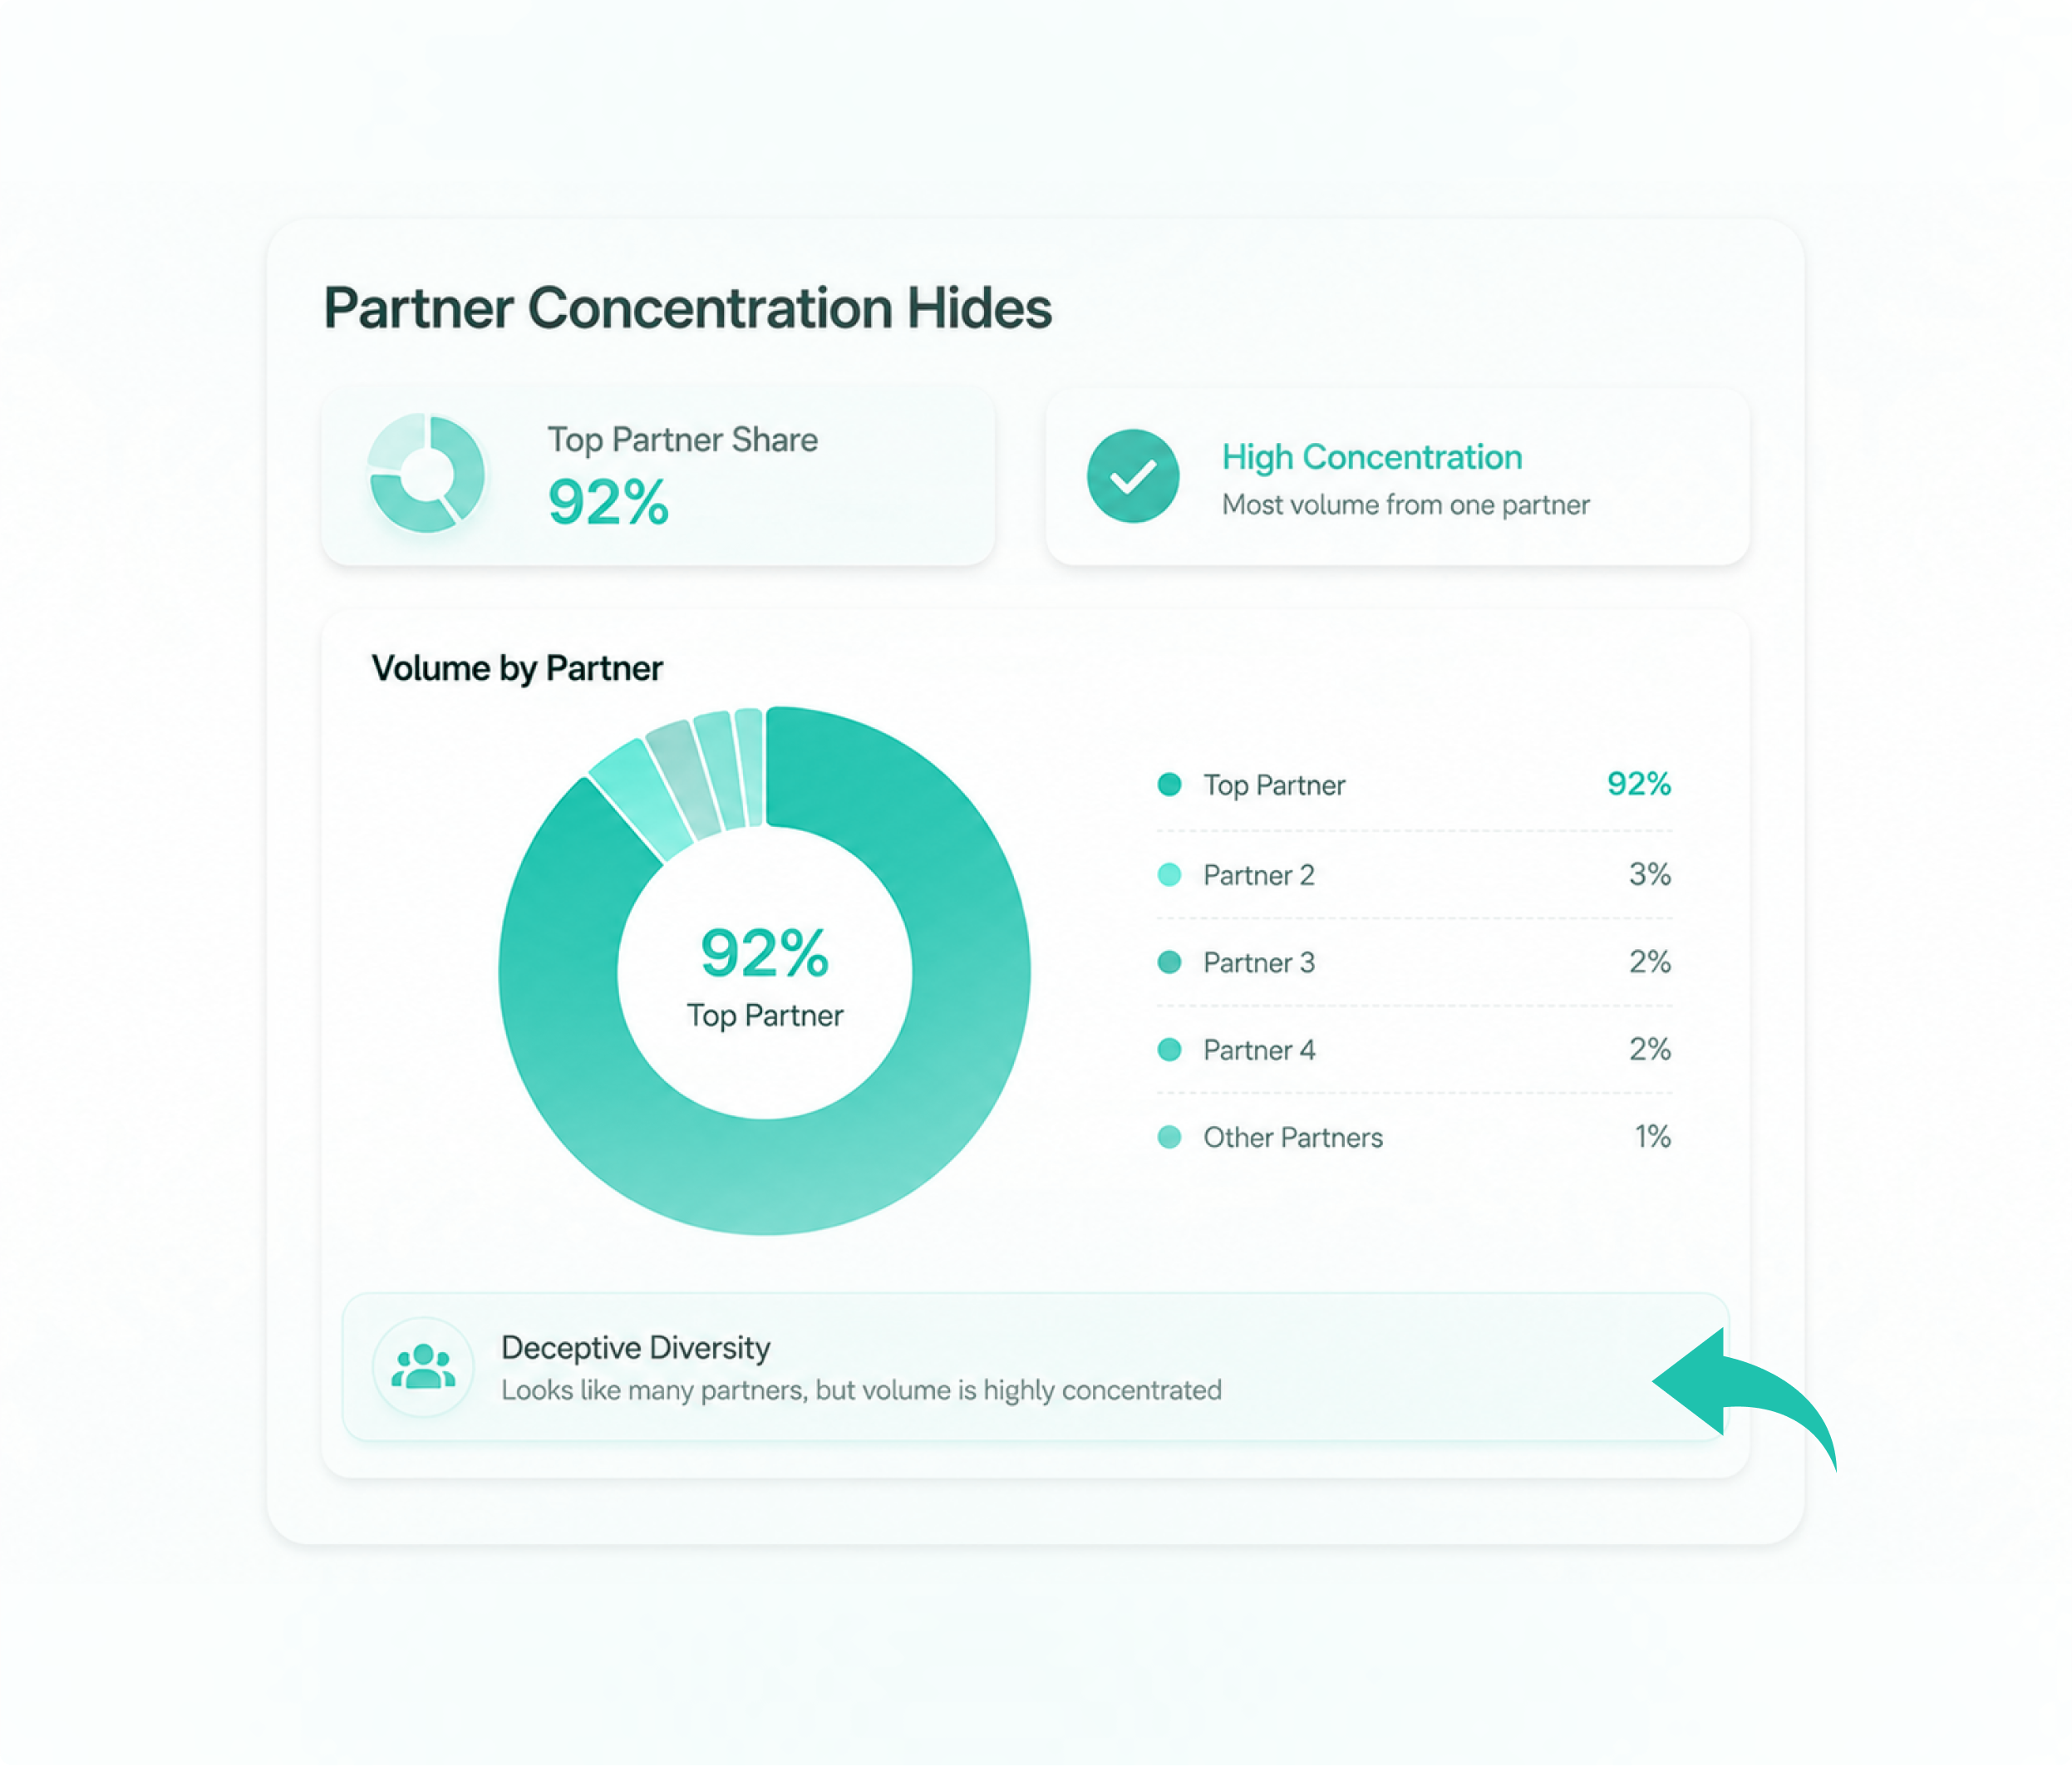
70% of Your Paid Installs Might Come From One Partner
Concentration Hides:
At the median, 70% of paid installs still come from just a single largest partner, even with
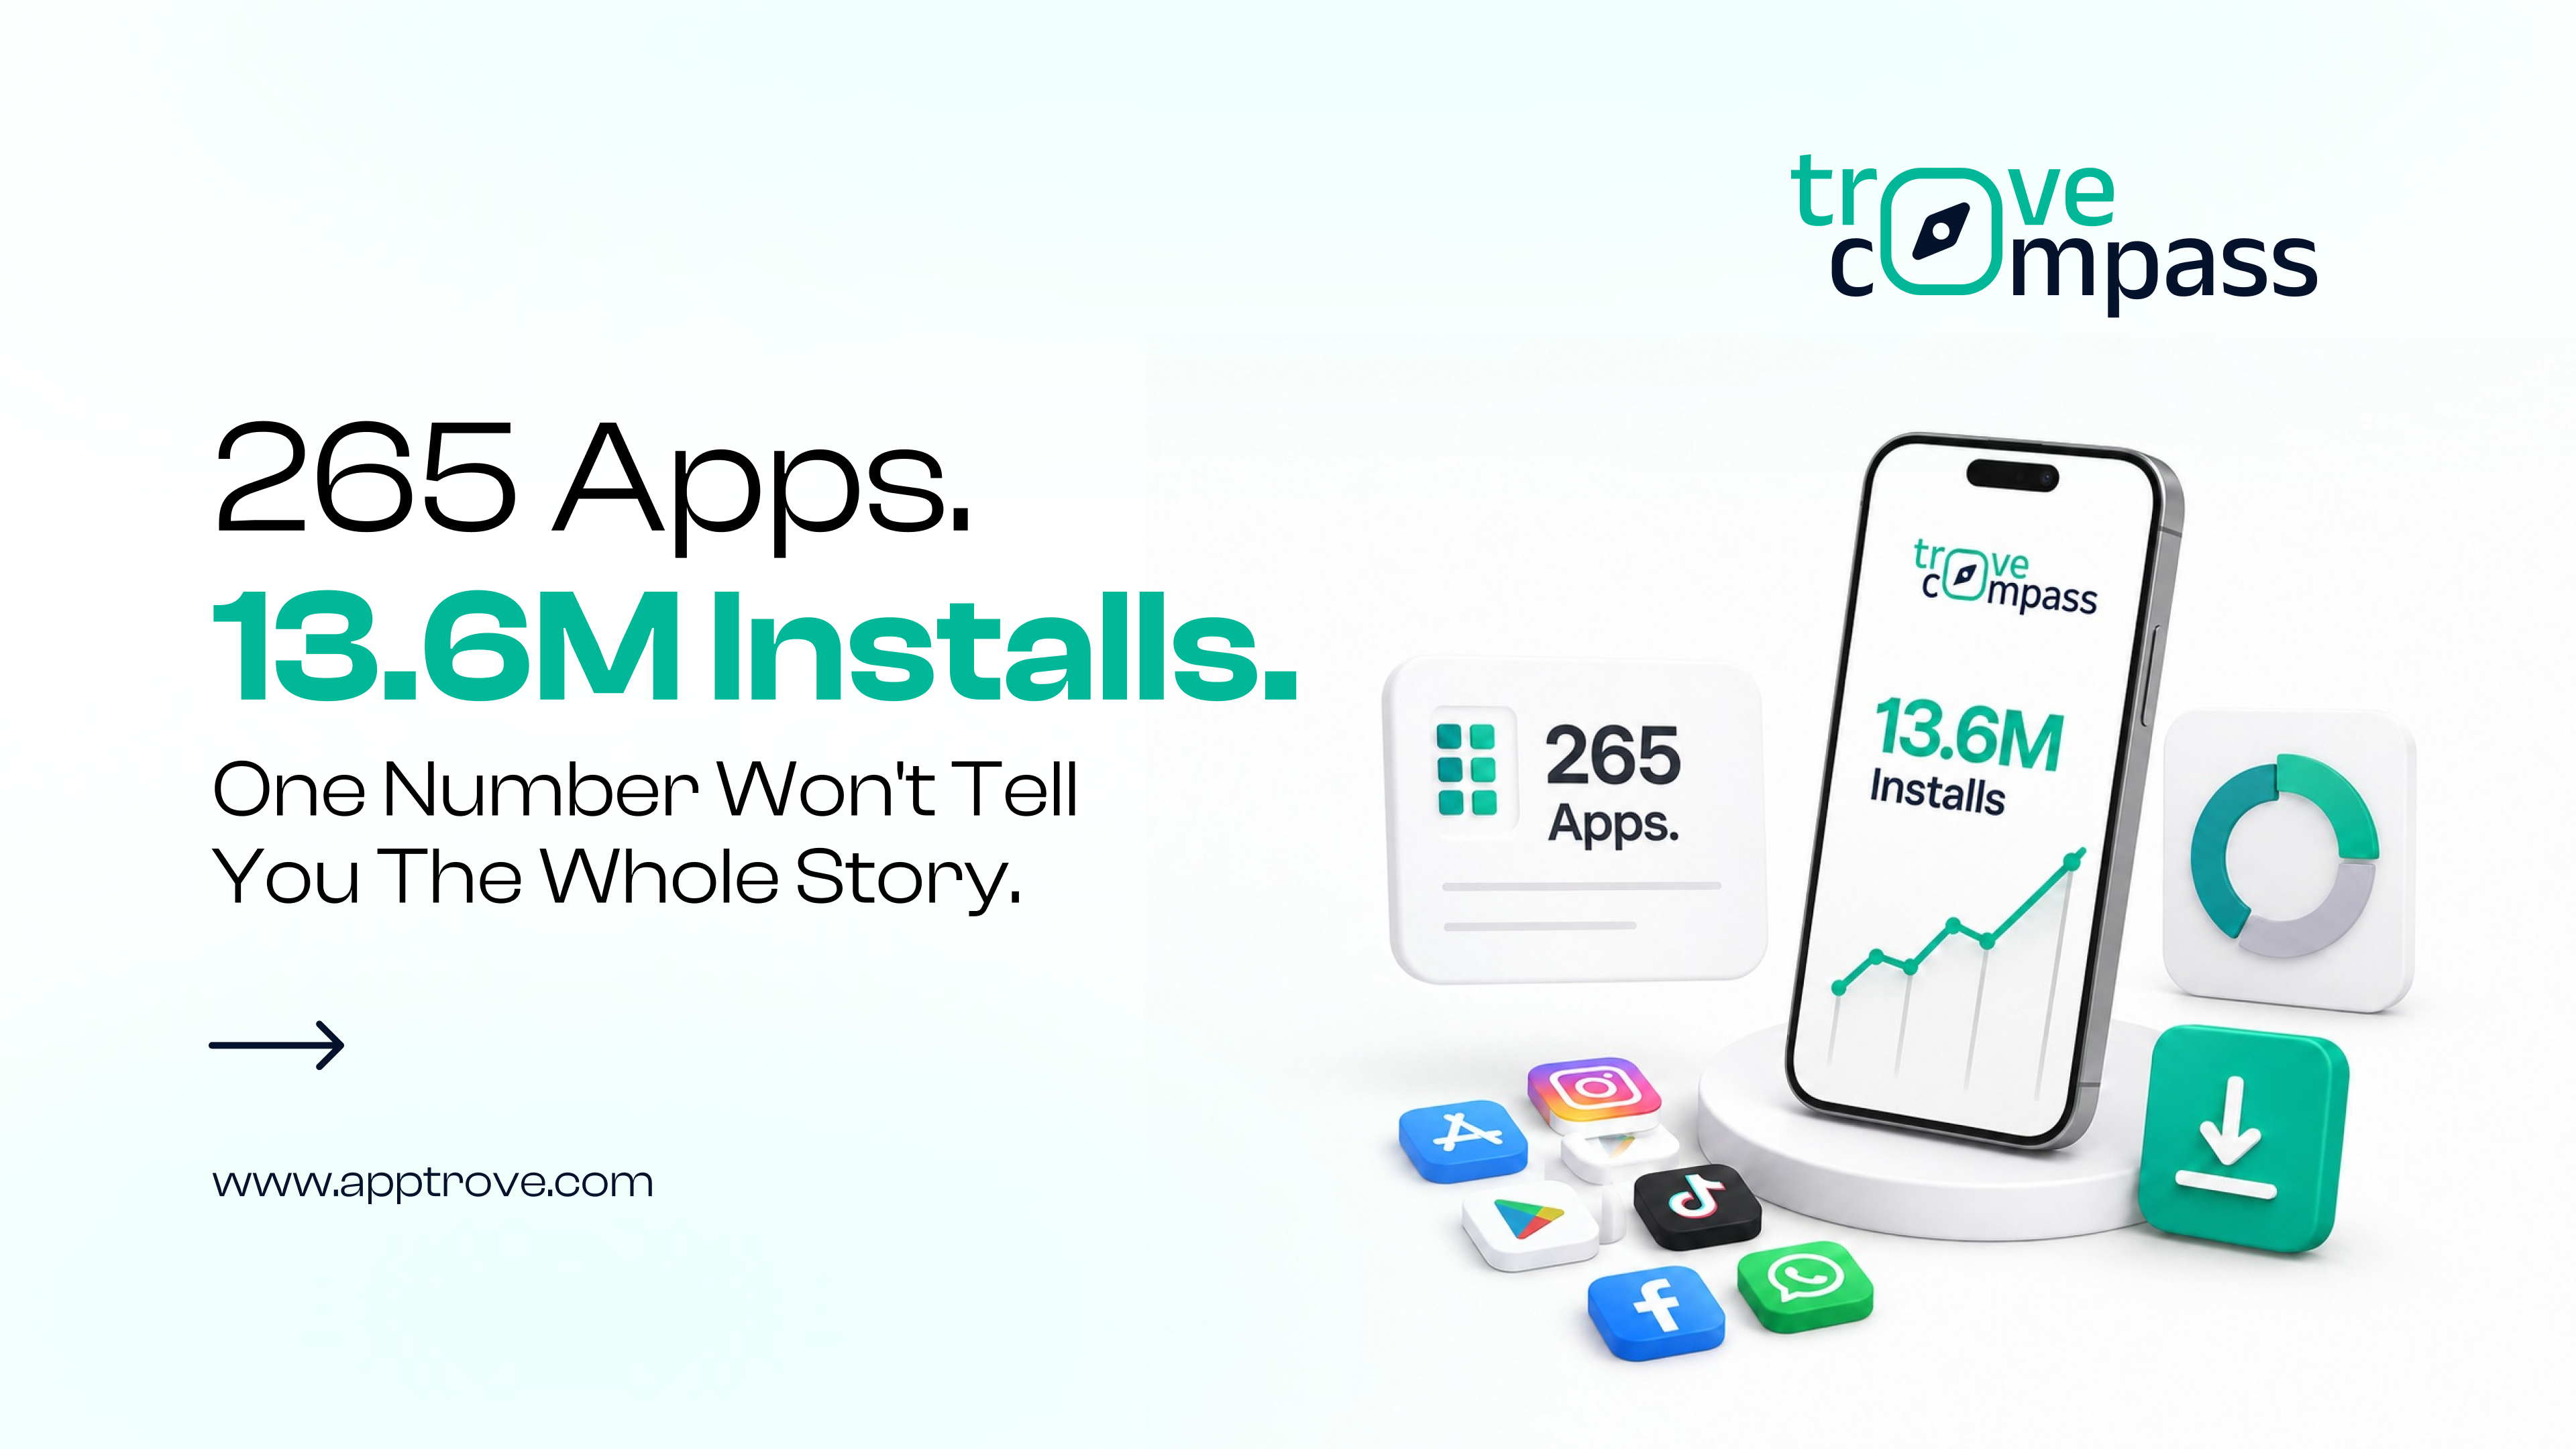
One Number Wont Tell You The Whole Story.
Hey there, {{ personalization_token('contact.firstname', 'Marketer') }}
{{ include_custom_fonts({"Apptrove Clash Display":["Light","Medium","Regular","Semi Bold"]}) }}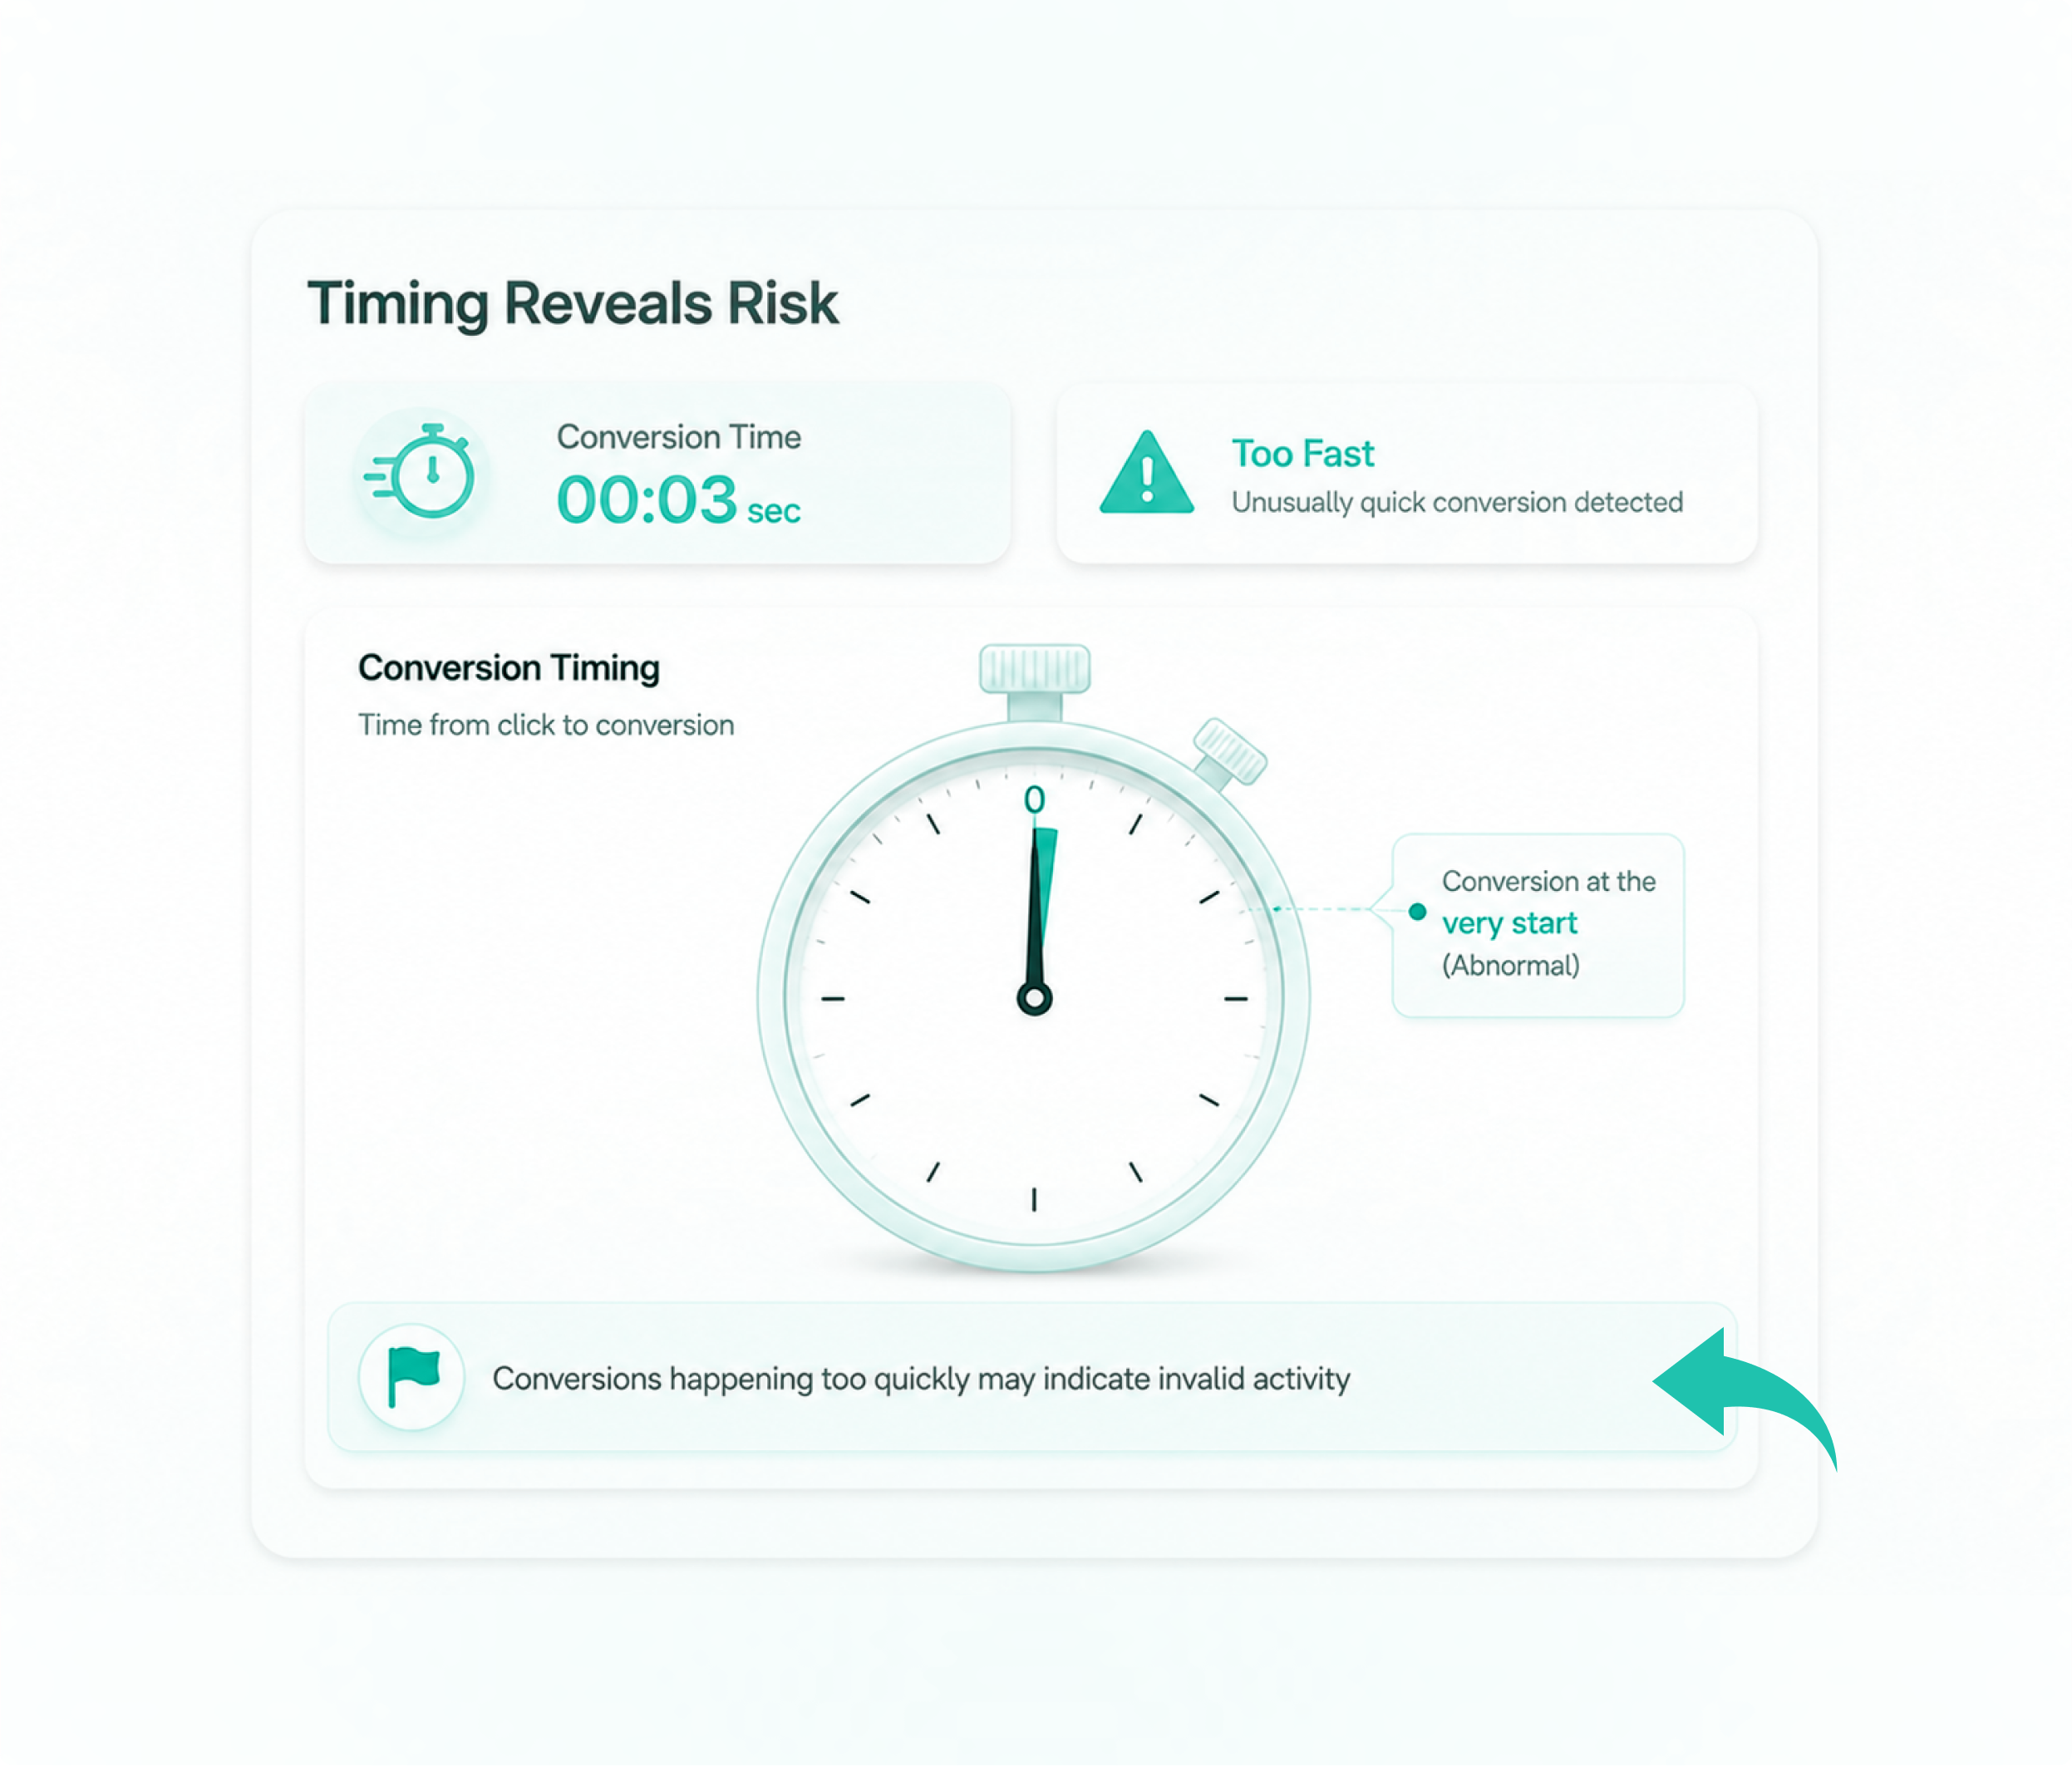
Your Install Report Is Only Answering Half The Question
Most acquisition dashboards stop at installs, CPI, and ROAS. But behind every install is a longer chain: exposure, engagement, attribution, activity, retention, re-engagement. Apptrove analyzed 265 apps across 101 organizations, representing 13.6 million installs between May and July 2026, to see what that chain actually reveals. The findings say the same thing from four different angles: a basic install count cannot answer whether your acquisition is actually working.
{{ include_custom_fonts({"Apptrove Clash Display":["Light","Medium","Regular","Semi Bold"]}) }}
Timing Reveals Risk:
2.8% of paid installs landed within just 10 seconds of the actual ad click, a pattern tied to
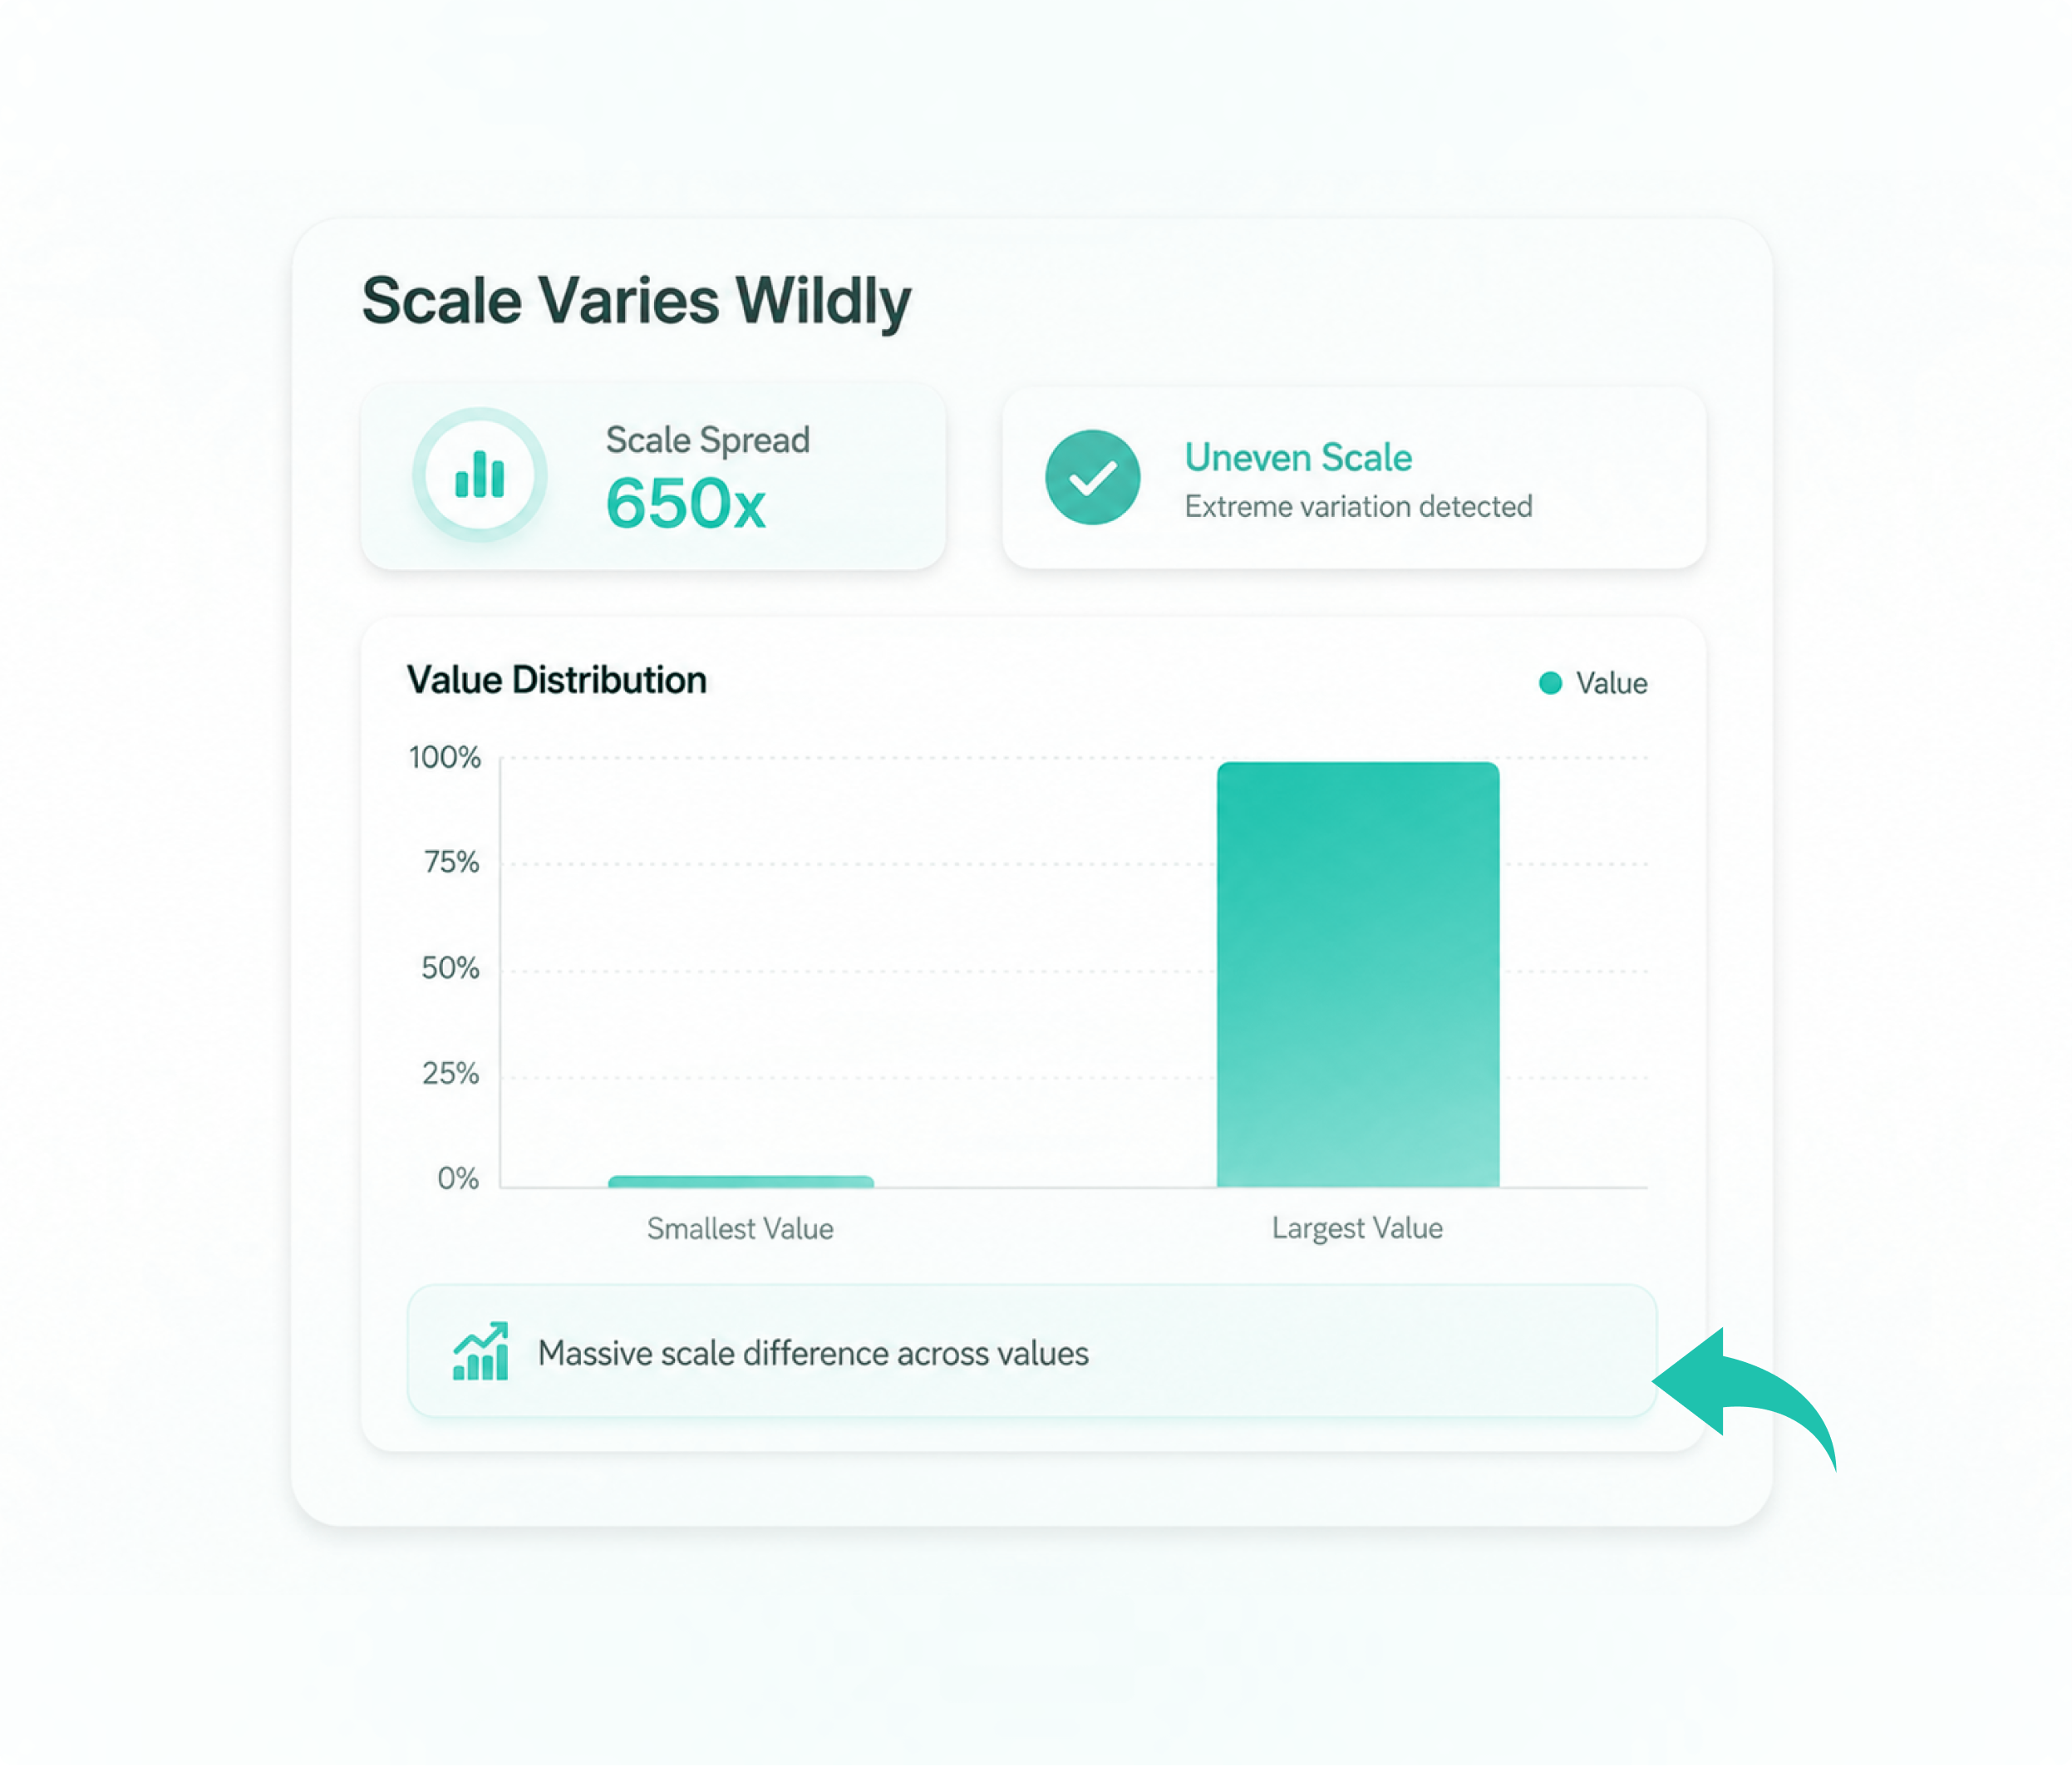
Scale Varies Wildly:
Monthly installs range from 372 to 240,874 apps at opposite percentiles, a 650x spread that
{{ include_custom_fonts({"Apptrove Clash Display":["Light","Medium","Regular","Semi Bold"]}) }}
An app can have high install volume and still be dangerously dependent on one partner. It can run dozens of partners and still be more concentrated than one running three. None of this shows up in a basic install report; it only shows up when you look at the mechanics underneath.
{{ include_custom_fonts({"Apptrove Clash Display":["Light","Medium","Regular","Semi Bold"]}) }}
See What's Hidden
Uncover The Rest
More partners don't always mean more diversification; the data says otherwise.
Preview Text This will be used as the preview text that displays in some email clients