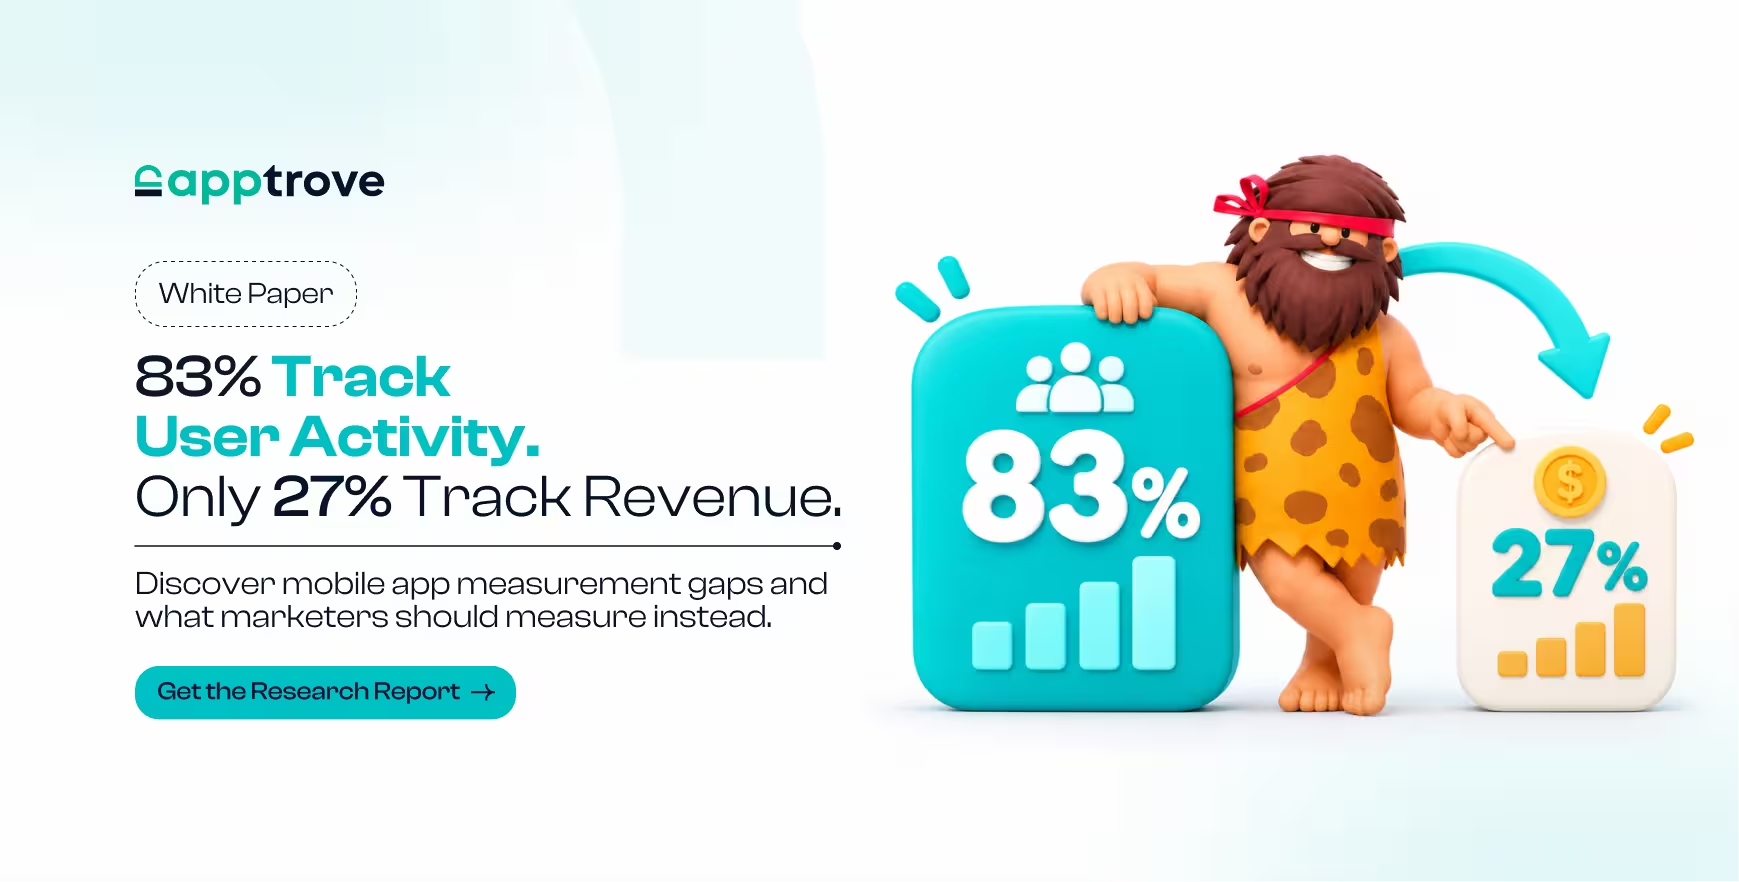
83% of apps measure an identity event, but only 27% measure any monetary events. How much do your marketing KPIs really tell you?
App marketers now have access to more data than ever before. They can measure installs, registrations, logins, screen views, and in-app events. But it can be complicated to know if you’re measuring the right things.
The challenge is knowing what to measure to understand how well your app is performing.
A recent study undertaken by Apptrove shows that there are huge gaps in how we measure our mobile apps, with 1.77bn in-app events from 195 applications (44.2 million users) over a 90-day period. With this, we can see gaps in how we are measuring our apps when it comes to understanding the quality of our acquisition, generating revenue, and measuring the user lifecycle.
The study includes fintech, broking, lending, D2C, health, and media.
Download the Apptrove research white paper to understand more about the findings, what is missing from your measurement strategy, and learn what to measure.
More Data. But Are You Measuring What Actually Matters?
Having lots of installs may look great on your dashboards but what if they aren’t converting through onboarding? Or making purchases? Or contributing any revenue?
This is where activity-based measurements start to fall down.
Our research shows there is a big gap between identity events and meaningful business events.
- 83% of applications are measuring an identity event (registration/login).
- 50% are measuring a monetary event (purchase/subscribe/deposit/trade).
- 27% are linking revenue to a monetary event.
- 18.5% are measuring uninstalls.
- 4.1% are measuring re-engagement.
- 25.6% of paid events have no campaign identifier.
This tells us we often can see who is coming into our applications but struggle to understand what they are doing for the business.
By understanding the gaps in how we measure our mobile apps, we can improve our measurement strategy.
What Does the Research Reveal?
The white paper will show you how we can improve our measurement strategies by looking at the 7 key areas:
1. Identity vs Revenue
Although registration and login events are popular, we can see there is a large gap when it comes to measuring monetary events. Understand why we should not be focusing on measuring our first conversion.
2. Not measuring all 6 fundamentals
None of the 195 applications measured all of the 6 fundamentals (identity, activation, monetary, revenue, re-engagement, and uninstall). See why there is a gap in the data.
3. Too many activity events
53% of the total events measured are activity events (logins, browsing and cart). Only 0.9% of events are monetary. Find out why.
4. Not measuring the right events
Approximately 3000 named events were found but 669 of them were not firing more than 100 times a month. Understand why.
5. Not measuring revenue
Only 27% of applications were measuring revenue. Learn why we should not be measuring just the transaction without understanding its value.
6. Not measuring user lifecycle
Only 18.5% of applications were measuring uninstalls and 4.1% re-engagement. See why we should understand churn and re-engagement.
7. No campaign identifiers
25% of paid events had no campaign identifiers. See why.
What should app marketers be measuring?
It’s not about measuring more events; it’s about measuring the right events.
The research shows us how to measure using the 6 fundamentals.
Identity > Activation > Monetary > Revenue > Uninstall > Re-engagement.
Understanding what each of these events is telling us:
Identity – Who has registered/login.
Activation – Who has completed meaningful onboarding activities (KYC, opening an account).
Monetary – Who has completed an action that generates revenue.
Revenue – Who has made a transaction and how much it has contributed.
Uninstall – Helps understand early churn with your sources of acquisition.
Re-engagement – Understand how many users come back with owned and paid retargeting.
If your app is revenue-driven through advertising, then measuring ad revenue is also very important. If you are measuring campaign identifiers on your paid events, it will help you understand which campaigns are converting.
This gives you a starting point to overcome the gaps in your mobile measurement.
This research is based on Real Data from mobile apps. We looked at:
| Research parameter | Coverage |
| Total in-app events | 1.77 billion |
| Users analysed | 44.2 million |
| Applications studied | 195 |
| Research period | 90 days |
| Industry sectors | 6 |
Whether you are managing paid acquisition, looking to improve campaign performance or improve your application events, this research will give you a data-led insight into what you may be missing.
Who should read this white paper?
This research is perfect for anyone involved with growing, performing and measuring mobile apps.
App marketers/User Acquisition Managers – Understand why having lots of installs and registrations won’t tell you the quality of your acquisition.
Growth/Performance Marketing Teams – Understand which app analytics are showing you the connection between campaign performance and generating revenue.
Marketing analysts – Understand how not measuring all events and campaign identifiers impacts your reporting.
Product/Analytics Teams – Understand the importance of having consistent event naming and implementation as well as measuring user lifecycle.
Business/Growth Leaders – Understand if you are getting enough visibility of your revenue and user performance.
Your Marketing Dashboard Shows the Numbers. Do You Know What They Mean?
There is a big difference between measuring activity and actually measuring what is impacting your business. This can impact how your marketing teams look at their campaigns, budget and optimisation.
The research shows that it’s not about measuring the most events but making sure you are measuring events that are giving you useful information.
We need to move away from measuring installs and focus on activation, activity to revenue and understanding user lifecycle.
Want to know what you could be missing?
Download the Apptrove research white paper to understand all 7 findings, see the data, and learn what to measure to make smarter mobile growth decisions.