

Cohort reporting is a way of grouping your customers based on when they signed up or how they signed up. This helps marketers to see inside the user behavior they wouldn’t otherwise be able to see, as many behaviors are hidden in the average.
Cohort Reporting in Apptrove allows you to monitor installs, uninstalls, in-app events, sessions, revenue, ARPU, and more. You now would be able to see how customers stick with your app over time, as well as how active they are in the app, in terms of revenue, installs, and events. When it comes to mobile apps and games, where much of the value lies in those who churn rapidly or whose conversion and monetization are a long-term play, any user who has access to tools that can track user engagement and behaviour related to revenue can have a leg up on the competition.

Features of Cohort Report in Apptrove
Three Flexible Ways To View Cohort Data
The following are the three distinct cohort reporting views that Apptrove provides to enable marketers to analyse their data in the most meaningful ways:
- Unified View: The unified view of the cohort report gives marketers the opportunity to join acquisition and retargeting data to create a complete report. Last-touch logic is implemented in a manner that, when the customer interacts with multiple campaigns, the latter doesn’t get connected with the retargeting events, and only the last one is counted. That enables the marketers to have a full view of the customer’s actions with all campaigns and touchpoints.
- User acquisition view: User acquisition view is only concerned with installs and can calculate the success rates of each channel in achieving the desired results in terms of acquiring users and can assess customer quality acquired via each channel. This perspective is ideal for knowing which acquisition campaign would generate the most valuable customers.
- Retargeting View: The retargeting view enables performance analysis of retargeting campaigns by viewing what happened to the returning customers that have been re-engaged through the campaigns. This perspective can provide insights into the success of retargeting campaigns in terms of session generation, actions, and revenue generation for past customers.
Apptrove’s Cohort Reporting offers a variety of perspectives for marketers to help them assess both their acquisition performance and their retention trends with a high level of detail and granularity.
Multiple Metrics for Full-Funnel Insights
You can use multiple metrics to get full-funnel insights. There are multiple metrics available to get full-funnel insights. Cohort reporting in Apptrove is more than just the basic retention metrics. The following metrics can help marketers ensure that they are gaining the most they can from their app’s performance:
- App installation and app uninstalls metrics of the application help you understand the churn rate and help identify application drop-off points.
- The in-app event metrics, on the other hand, enable you to analyze the total number of events and the average number of events per user, as well as the number of users taking specific actions.
- User session metrics can be used to measure user engagement by determining the number of sessions conducted by the users.
- Revenue metrics can be used to assess the application revenue, average revenue per group of users (ARPU), and average revenue per given in-app event, to determine which group of users is most beneficial for the application.
Such an approach enables marketers to measure user retention, engagement, conversions, and revenue.

Granularity & Time Windows
With the ability to go as deep as necessary, the cohort features that Apptrove provides provides marketers with flexibility in reporting. The following time periods are supported:
- Days: Find out what happens in the last 120 days
- Hours: Find out about early engagement in the last 72 hours
- Weeks: Find out about trends in the last 28 weeks
- Months: Find out about what happens in the last 4 months
This flexibility helps you identify both early drop-offs and long-term retention trends, enabling precise optimization.
Visualize Patterns With Heatmaps
Apptrove has tools for cohort reporting which enable them to see trends in performance of specific cohorts by using multiple-colour heatmaps.

Why Apptrove’s Cohort Report Changes the Game Completely
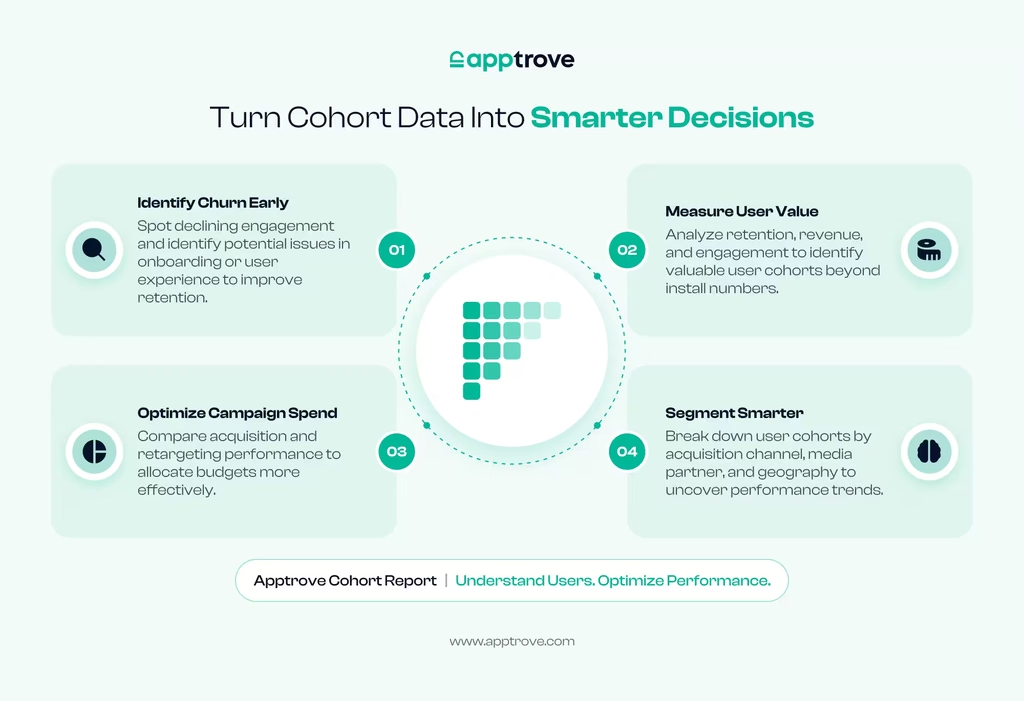
- Detect churn as soon as you can: Recognize when a user starts losing interest and find out how we will solve potential issues with onboarding, user experience, and the marketing strategy. This knowledge can increase the likelihood of reacting in time, increasing retention, and engaging the user.
- Assess real value: Focus not solely on the number of installations but also on retention, revenue, and engagement. You’ll know which cohorts to choose as valuable ones, and you’ll be able to make decisions when you have an understanding of how the user acts with your app.
- Analyze campaigns: Understand the cost of acquiring customers and retarget campaigns, and determine which campaigns are better. Use these findings to make the most of your marketing dollars, maximize assets, and boost the efficiency and effectiveness of your campaigns.
- Employ smart segmentation: Segmentation by a few properties such as channels of acquisition, media partners, or geographical area. This behavior will guide you to make inferences about performance between groups, uncover new opportunities for improvement, and enhance your targeting strategies.
Get Started with Cohort Report
Today, Cohort Reporting by Apptrove is officially out and can help you get your users’ feedback about their behaviour, retention, and revenue by providing you with flexible account views, multi-metric tracking, a detailed timeline, and heat maps for better marketing decisions, improved campaigns, and market growth. Check out Cohort Reporting in your Apptrove dashboard today!