Mobile marketing is a must-have strategy for businesses wanting to connect with and engage today’s digital-first consumers.
With smartphones dominating how people search, shop, and connect, businesses must focus on the mobile-first shift.
Today, mobile-first indexing, rising app engagement, and increased mobile advertising market are reshaping how brands reach their audiences.
In this post, we’ll explore the latest mobile marketing statistics that every marketer needs to know to stay competitive in the rapidly growing mobile advertising market. These valuable insights can strengthen your strategies and help you gain a competitive edge.
Let’s unearth the mobile marketing statistics defining the future. First, let’s see the overview of the mobile marketing landscape in 2025 and the key factors driving its growth.
Overview of the Mobile Marketing Landscape in 2025
Mobile phone ownership has more than doubled over the past decade.
According to recent reports –
- Stat #1: Mobile devices account for around half of web traffic worldwide.
- Stat #2: Mobile devices (excluding tablets) generated 58.67% of global website traffic in the last quarter of 2023.
In short, mobile phones are becoming the go-to device for everything, and this trend will grow even further. So, businesses must prioritize it to reap the best benefits of mobile marketing in 2025 and beyond.
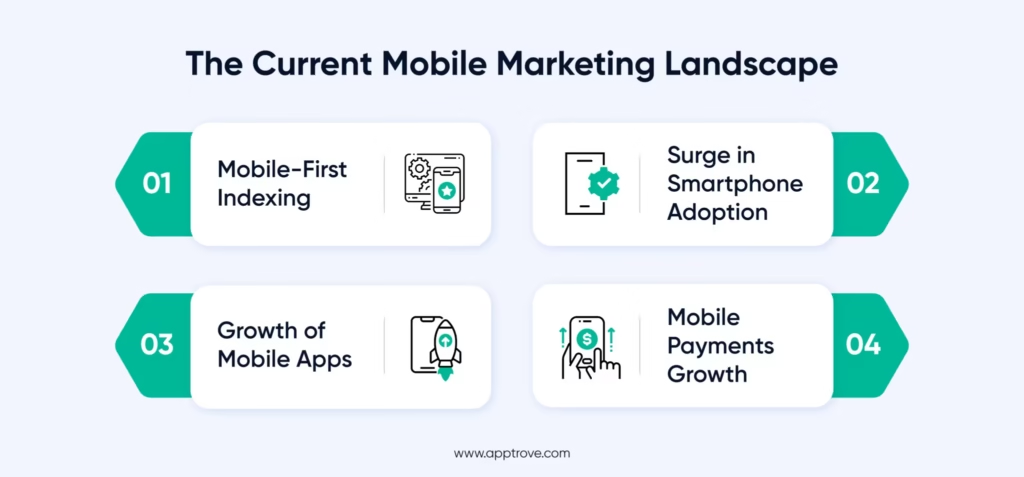
Let’s see the top factors driving this massive mobile marketing growth.
- Mobile-First Indexing: Google’s push for mobile-first indexing isn’t just about SEO rankings. It’s more about providing an exemplary user experience. So, websites must be fast, responsive, and mobile-optimized to dominate search results.
- The Surge in Smartphone Adoption: Smartphone adoption is increasing tremendously.
- Mobile-First Indexing: Google’s push for mobile-first indexing isn’t just about SEO rankings. It’s more about providing an exemplary user experience. So, websites must be fast, responsive, and mobile-optimized to dominate search results.
- Stat #3: The latest data reveals that 70.3% of the world’s population now uses mobile phones.
- Stat #4: The number of “unique” mobile users reached 5.75 billion in October 2024.
So, if your marketing strategy isn’t designed for mobile, you’re missing out on a massive opportunity to engage with this growing audience. Mobile apps are no longer just an add-on.
- Stat #5: The global app downloads crossed 257 billion downloads in 2023, which is proof of how crucial they have become for customer engagement.
From attracting customers to providing personalized experiences and achieving brand loyalty, mobile apps can help a brand stand out. No wonder, industries like eCommerce, gaming, and OTT are leveraging mobile apps to ensure customer retention.
For instance, eCommerce marketers leverage dynamic ads to display personalized product recommendations based on browsing history. This improves customer experience.
Mobile Payments Growth: Mobile shopping apps integrated with mobile payment solutions transform how consumers buy products.
- Stat #6: The global mobile payment market, valued at USD 2.98 trillion in 2023, will cross USD 27.81 trillion by 2032, with a CAGR of 28.1%.
This means mobile commerce is growing rapidly. Therefore, businesses must optimize their mobile strategies by checking the latest mobile marketing statistics to meet consumer demand.
Key Mobile Marketing Statistics for 2025
Global Mobile Adoption and Usage Growth
Smartphone usage is growing fast, making mobile a vital platform for businesses to prioritize.
Stat #7: The global number of unique mobile customers is increasing annually by 1.8%, reflecting steady growth.
Stat #8: The number of smartphone users worldwide is set to increase by 1.7 billion – a 37.98% rise between 2024 and 2029.
Stat #9: The total number of users will cross 6.2 billion by 2029, reaching a new peak.
Stat #10: China has 845.38 million mobile users, making it the largest smartphone market in the world.
Stat #11: India follows closely with 613.3 million smartphone users, highlighting its rapidly growing mobile-first population.
Stat #12: Smartphone adoption in the Asia-Pacific region (APAC) jumped from 64% in 2019 to 78% in 2023. It’s expected to exceed 90% by 2030. This reflects a massive opportunity for businesses looking to expand in this fast-growing region.
Stat #13: North America has the highest smartphone adoption rate as of 2023, with 84% of total mobile connections. Its smartphone adoption rate will reach 89% by 2030, but regions like Eurasia and Asia-Pacific will experience even bigger growth.
Why This Matters for Marketers
- The mobile adoption rate and usage reflect why every marketer must implement a mobile-first strategy.
- With billions of users in regions like China, India, and APAC, optimizing content and ads for mobile platforms can prove a game-changer.
- The surge in smartphone adoption, especially in emerging markets, offers a chance to tap into new audiences.
- Brands that adapt now will gain a competitive edge as mobile usage continues to dominate the digital ecosystem.
Mobile User Behavior and Insights
Mobile devices are reshaping how people access and interact with the internet. Here are the key statistics highlighting the global shift towards mobile-first usage.
Stat #14: Reports reveal that around 9 in 10 (92.3%) internet users access the internet using a mobile phone, highlighting its dominance as the primary mode of connectivity.
Stat #15: Mobile accounts for 60.81% of online traffic, surpassing desktops, which contribute just 37.15%.
Stat #16: India, Nigeria, Ghana, and Kenya lead the way in mobile-first internet traffic, with most of the web traffic coming from mobile devices.
Stat 17#: Mobile dominates with over 50% of web traffic across African markets, while in the United States, it accounts for 45.49%.
Stat 18#: People across the globe spend an average of 3+ hours daily on their mobile devices, amounting to nearly 1/3rd of their daily waking hours.
Stat #19: The average American spends 4 hours and 37 minutes on their phone daily. That’s the equivalent of over 1 day per week or 6 days per month. Moreover, that’s approximately 70 days spent looking at a phone in a year.
Stat #20: Android dominates the share of mobile web traffic with 70.48%, followed by Apple at 28.8%. Collectively, the two make up 99.28% of all mobile web traffic.
Stat #21: Device ownership data shows that 97.6% of internet users aged 16-24 own a smartphone.
Stat #22: While 90% of internet users are accessing the internet via a laptop/desktop/tablet, 98.1% are accessing the internet on their phones.
Why This Matters for Marketers
- Emerging economies like India and parts of Africa present untapped opportunities for mobile-first campaigns.
- With high smartphone adoption among younger demographics, mobile offers direct access to the most active online audience.
- Android’s majority market share and Apple’s premium audience create distinct opportunities for targeted marketing.
Mobile Apps and Downloads
Mobile apps are transforming how people interact with brands and services.
Stat #23: A staggering 257 billion global mobile app downloads were recorded in 2023, highlighting a massive demand for apps.
Stat #24: Mobile apps will generate more than 613 billion US dollars in revenues by 2025.
Stat #25: Users spent an average of 5 hours daily on mobile apps in 2023, reflecting their deep integration into daily lives.
Stat #26: The mobile games app segment will cross 176.1 billion downloads by 2027.
Stat #27: 40% of consumers will abandon their carts if the app isn’t mobile-friendly.
Stat #28: Operating systems like iOS, Android, and Windows mobile phones dominate the market.
Stat #29: 63% of smartphone users are more likely to buy from brands offering personalized recommendations via mobile sites or apps.
Stat #30: 58% of smartphone users feel positively towards brands whose mobile sites or apps remember their past behavior.
Stat #31: According to recent mobile marketing statistics from Statisa, the global market was estimated at 11 billion US dollars, and the source projected that it would reach 57.85 billion dollars by 2030 at a CAGR of 18%.
Why This Matters for Marketers
- With billions in projected app revenue, businesses should prioritize app-based offerings to capture this lucrative market.
- Mobile apps that provide tailored recommendations and remember user preferences can help increase conversion rates.
- With users spending hours on apps daily, creating engaging and valuable experiences can secure long-term customer loyalty.
Mobile Advertising Trends and Insights
Mobile advertising can help marketers earn revenue and achieve long-term growth. Let’s explore the key mobile advertising trends and insights depicting its potential.
Stat #32: Mobile ad spending will reach 4 billion dollars by 2027.
Stat #33: The annual app spending generated 171 billion US dollars in 2023.
Stat #34: The number of brands advertising their mobile apps reached 326.1 thousand by December 2023, a 50% increase year-on-year from 216.2 thousand in 2022.
Stat #35: Mobile advertising will account for $255.8 billion of the social media advertising market by 2028.
Here are a few more prominent in-app advertisement stats from Statista –
Stat #36: Ad spending in the in-app advertising market crossed $352.20 billion in 2024.
Stat #37: The market will experience an annual growth rate (CAGR 2024-2029) of 8.68%, leading to a projected market volume of $533.90 billion by 2029.
Stat #38: The average ad spending per mobile internet user in the in-app advertising market will cross $53.88 by 2024.
Stat #39: China generated the highest ad spending, reaching $132.80 billion in 2024.
Stat #40: The US continues to drive innovation and investment in in-app advertising, setting trends and shaping the global market.
Why This Matters for Marketers
- The massive year-on-year increase in mobile app advertisers reflects a broader shift toward mobile as a primary channel for reaching consumers.
So, marketers should leverage different mobile ad formats to engage users and offer personalized experiences. - Markets like China and the US highlight distinct leadership in mobile advertising. Brands can tailor mobile marketing strategies to maximize performance in these high-value regions.
- In-app advertising helps brands connect with users right inside the apps they like. Leveraging in-app advertising can help marketers and decision-makers tap into a rapidly expanding revenue stream.
- Integrating mobile ads into social campaigns can maximize reach and engagement.
Summing Up
Mobile has become the key channel for connecting with customers. The mentioned statistics are proof. Hence, implementing a mobile-first approach is crucial. It can help deliver engaging user experiences and boost customer acquisition and retention in the long term.
Our MMP platform, Apptrove, can empower marketers to capitalize on mobile trends through its state-of-the-art features. It simplifies campaign management with unified mobile app analytics and reporting, allowing marketers to track performance and make data-driven decisions.
With comprehensive attribution features, such as real-time fraud prevention and deep linking capabilities, mobile marketers can deliver superior app experiences.
What’s more? Its customization capabilities provide flexibility to tailor attribution windows, set validation rules, and optimize campaigns for maximum impact.
FAQs
1. Why is mobile marketing so important in 2025?
Mobile dominates web traffic, app engagement, and ad spending. With smartphones becoming the primary device for search, shopping, and social connection, brands that adopt mobile-first strategies gain a competitive edge.
2. What are the latest mobile marketing statistics businesses should know?
Key stats show that over 70% of the world’s population uses mobile phones, global app downloads crossed 257 billion in 2023, and mobile payments will surpass $27 trillion by 2032. These trends highlight why businesses must optimize for mobile.
3. How does mobile-first indexing affect my business website?
Google prioritizes mobile-friendly websites in search results. A fast, responsive, mobile-optimized site not only boosts SEO but also enhances user experience, directly influencing engagement and conversions.
4. What industries benefit most from mobile marketing trends?
eCommerce, gaming, OTT, and fintech are leading adopters. These sectors rely on mobile apps and advertising to deliver personalized experiences, increase engagement, and retain loyal users.
5. How can businesses leverage mobile apps to boost engagement?
By offering personalized recommendations, seamless mobile payments, and engaging in-app experiences, businesses can strengthen customer loyalty. With users spending 5+ hours daily on apps, this is a powerful growth channel.