
You’ve built a campaign with sharp copy, striking visuals, and polished creative assets. It looks like a winner, until the performance metrics come in. Click‑throughs are modest, conversions are weak, and your budget is vanishing faster than you’d like. In April 2025 the average CTR of the mobile apps in Google Ads only reached 3.31%, whereas the best search campaigns achieved 8.29%.
This is where creative analytics comes in. It measures how every ad creative actually performs, helping you optimize fast, target accurately, and maximize ROI. As a mobile measurement partner, Apptrove helps you combine creative analytics with advanced attribution, deep linking, and fraud prevention – giving you not just data, but actionable insights. The right MMP will allow you to take those good ads and make them great campaigns that increase your market penetration all across every mobile touchpoint.
What Is Creative Analytics?
Creative analytics is the process whereby the performance of your visual elements is measured and analyzed. Images, videos, headlines, and CTAs should all be evaluated primarily over campaigns and platforms.
When tracking performance metrics, you can see if an ad campaign achieved its goals. This includes performance metrics like click-through rates, conversion rates, engagement time, return on ad-spend, and more! All of these metrics give you a robust view as to which creative elements are working for you, which ones are not, and which need to be optimized.
You don’t guess why a campaign worked (or did not). With creative analytics, you discover: exactly why the campaign performed the way it did, and you can make adjustments based on data to improve future outcomes.
Why Good Ads Fail to Become Great Campaigns
Good-looking ads aren’t enough. Here’s why they sometimes underdeliver:
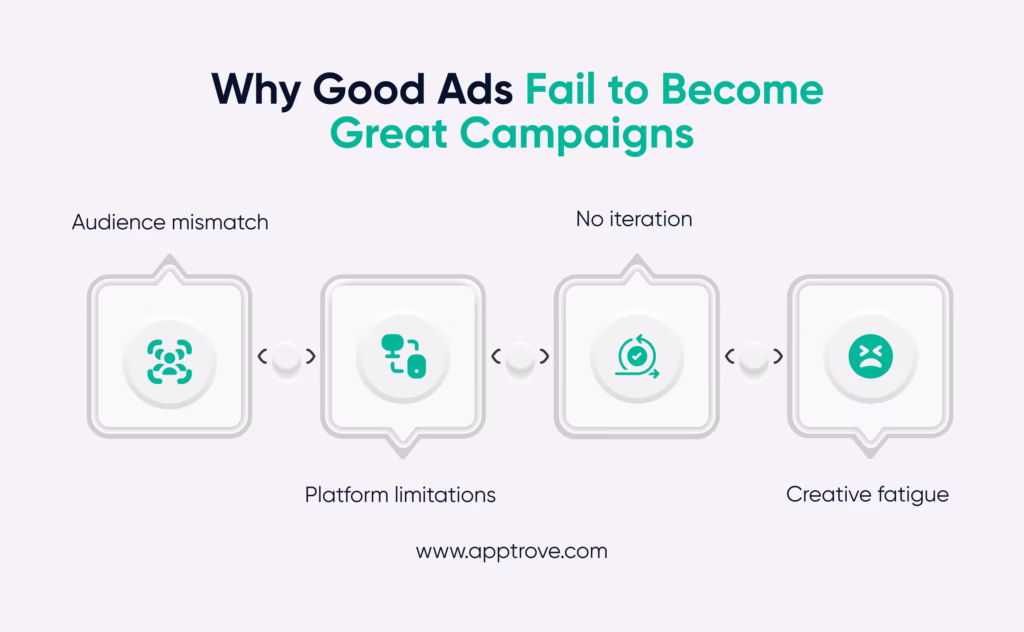
- Audience mismatch – Even the most beautifully designed creative assets can miss the mark if they don’t match your audience’s needs or preferences.
- Platform limitations – An ad creative designed for Instagram Stories may flop on Connected TV or display networks.
- No iteration – There is no measurement so creatives cannot be improved to perform better.
- Creative weariness – effective adverts become ineffective when used excessively.
Creative analytics helps you detect these issues early and optimize before your budget is wasted.
Why You Should Use Creative Analytics
The benefits of creative analytics go far beyond numbers on a report:
1. Faster Campaign Optimization
By analyzing performance metrics in real time, you can quickly swap out underperforming creative assets and focus spend on high-converting ads.
2. Audience-First Messaging
Creative elements are reacted upon differently by different segments. Creative analytics helps you identify those differences and customize ad creative for each audience.
3. Better ROI
You also save on wasted spending because you invest in high performing creatives with statistics.
4. Continuous Learning
Each campaign has contributed a new pool of creative outputs into your repository and so you start off each advert better than the other.
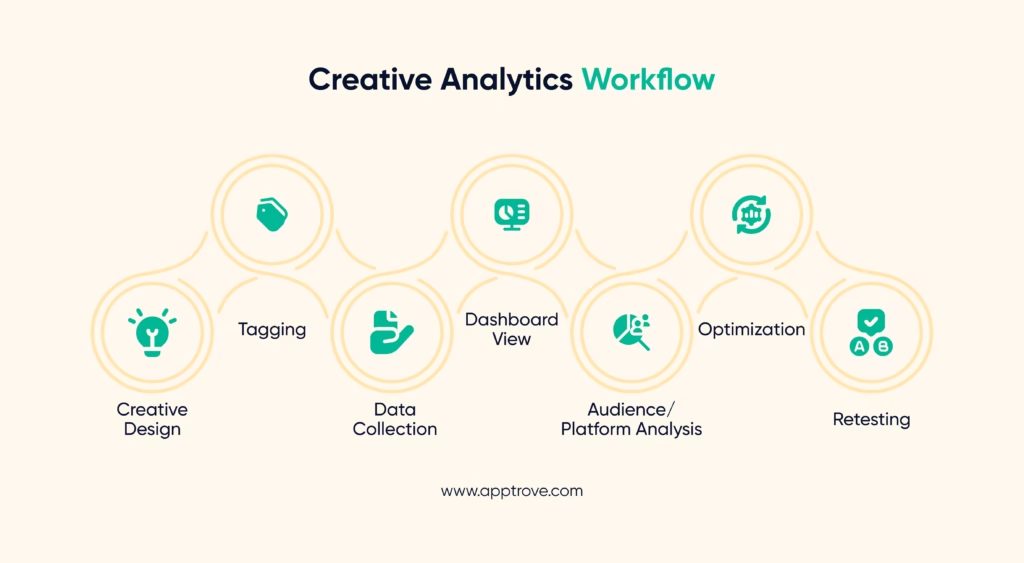
How Creative Analytics Works
Implementing creative analytics in your workflow is straightforward when broken into steps:
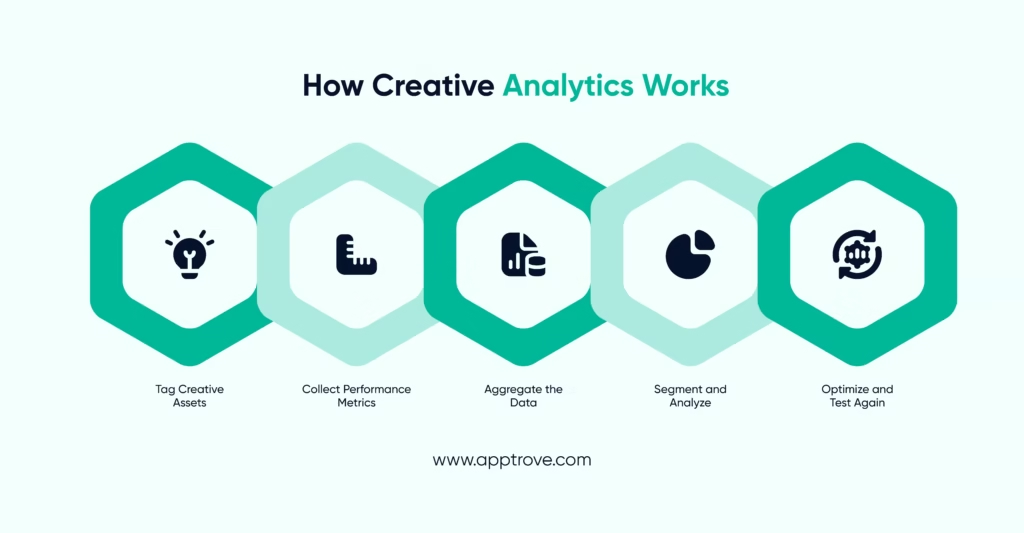
Step 1: Tag Creative Assets
Label each ad creative with campaign details, format, size, message, and CTA type. This ensures accurate tracking later.
Step 2: Collect Performance Metrics
Pull in data from all active platforms — Facebook, TikTok, Google Ads, DSPs, and Connected TV.
Step 3: Aggregate the Data
Use a unified dashboard, like Apptrove, to view all creative performance side-by-side.
Step 4: Segment and Analyze
Break results down by audience type, device, geography, and placement to uncover what’s really driving success.
Step 5: Optimize and Test Again
Retire underperformers, invest more in winners, and launch new variations to keep improving results.
Key Performance Metrics to Track
Essentially, you should be tracking Key Performance Metrics that directly correlate to your objectives when utilizing creative analytics:
- Click-Through Rate (CTR): Demonstrates the effectiveness of the creative to stimulate interest.
- Conversion Rate (CVR): Provides insight into the effectiveness of your ad creative.
- Cost Per Acquisition (CPA): Measures how cost-effective you are at acquiring customers.
- Engagement Time: This is especially critical when utilizing a video ad.
- Creative Fatigue Rate: Signals when the ad performance may beginning to fade.
- Return on Ad Spend (ROAS): Directly links performance of the creative to monetary benefit.
Creative Analytics in Action
Consider that you own a food delivery app that is mobile. There are two video ads being tested:
- Video A: Beautiful shots of food with a jovial music. CTA: Buy Now.
- Video B: Comic short story on the topic of waiting delivery that concludes with a happy customer.
After two weeks of tracking performance metrics:
- Video A has a better CTR, it is attention-grabbing.
- Video B performs better in term of CVR, as the story resonates with potential customers who want to buy.
With creative analytics, you allocate Video A to awareness campaigns and Video B to retargeting audiences. What it leads to is an increase in quality of budget usage, and greater outcomes on the whole.
Common Mistakes in Creative Analytics
Marketers sometimes fall into these traps:
- Not tagging creative assets properly, making analysis messy.
- Overemphasizing vanity metrics like CTR without looking at conversions.
- Skipping audience segmentation and assuming one creative fits all.
- Changing creatives too soon before enough data is collected.
- Reusing the same ad creative across platforms without adjustments.
With these developments, MMPs like Apptrove will play an even greater role by unifying creative analytics with attribution, segmentation, and fraud prevention.
Conclusion: From Good to Great
Creative analytics isn’t just about looking at numbers, it’s about uncovering the story behind every ad creative and using those insights to drive stronger campaigns. By tracking the right performance metrics, refining creative assets, and adjusting strategies in real time, you can stretch budgets further and connect with audiences more effectively.
When you have Apptrove as your mobile measurement partner, you enjoy an unified interface where you can monitor the performance of creative and attribute its outcomes correctly as well as eliminate the indebted spend. Whether you’re running social ads, programmatic campaigns, or CTV placements, creative analytics combined with a strong MMP ensures your marketing dollars are invested in what works, consistently turning creative potential into measurable growth.

FAQs
1. How often should I refresh creatives?
Watch for performance dips, creative fatigue can set in within days or weeks depending on frequency. Use performance data to decide when to refresh.
2. Can creative analytics work without automation?
Yes, but it’s labor-intensive. Automation (like via Apptrove) pulls tagged data across platforms, saves time, and improves accuracy. You still need human insight to act on results.
3. Should I adapt creatives differently for each platform?
Absolutely. What works on mobile may not perform on CTV or social. Customize creative formats for platform behaviors and monitor results separately.
4. What’s the biggest mistake marketers make with creative analytics?
Focusing only on vanity metrics like CTR without considering conversions or ROI. True optimization comes from combining engagement data with revenue-driven results.
5. Can creative analytics improve ad testing?
Definitely. It provides clear performance data for each variation, making A/B and multivariate testing more precise. This means you can identify winning creatives faster and scale them confidently.