“You’re Tracking Installs… But Missing These 5 Game-Changing UA Metrics” (P.S. #5 might be silently killing your conversions)
"5 UA Metrics You Should Track But Probably Aren’t"
Hey there, marketer,
So you're running user acquisition campaigns, getting installs, and seeing some traffic roll in. That's great. But here’s a question—are you looking at the metrics that matter?
Most people focus on surface-level numbers like installs and CPI (cost per install). But if you’re only looking there, you’re missing the full picture. Here are five overlooked metrics that could change how you grow your app.

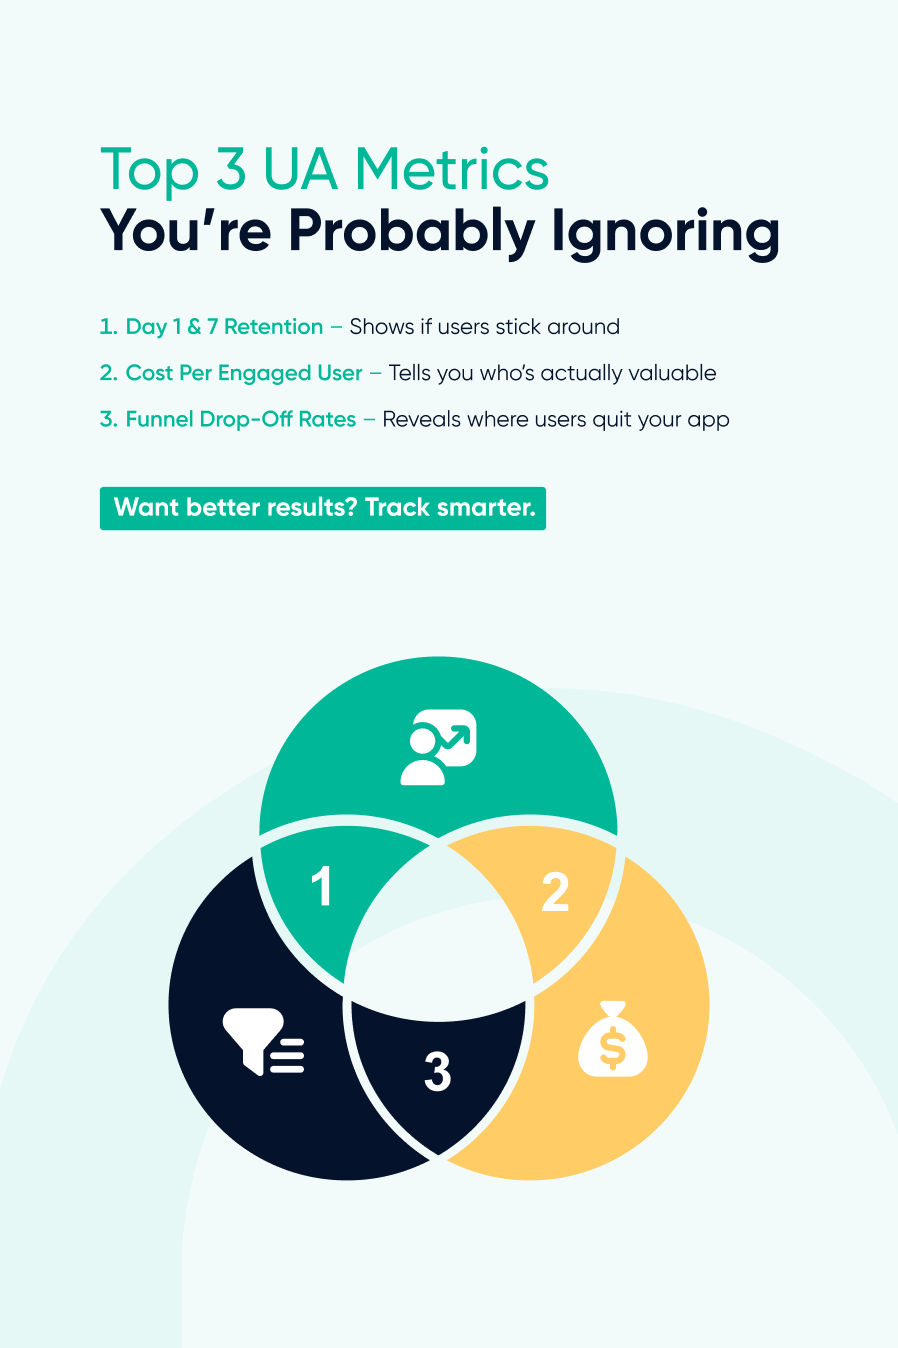
- Day 1 and Day 7 Retention
Installs mean nothing if users disappear after downloading. Day 1 and Day 7 retention tell you how many users are still opening your app one day and one week after installing it.
Why it matters: These metrics help you figure out if your onboarding is effective and if your app is valuable enough to keep people coming back.
- Cost Per Engaged User
CPI tells you how much it costs to get someone to install your app. But what about the users who do something, like create an account, complete a level, or make a purchase? That’s where Cost Per Engaged User comes in.
Why it matters: It shows the real value of your ad spend by focusing on users who stick and engage.
- Return on Ad Spend (ROAS)
You spend money to acquire users. But how much money are they bringing back into your business? ROAS helps you measure if your marketing is profitable or just expensive.
Why it matters: If ROAS is low, you're likely losing money. If it’s high, you’re winning. Simple.
- Creative Performance by User Segment
Not all users react the same way to your ads. What works for gamers in the US might flop for students in Brazil. Tracking how different segments respond to your creatives helps you fine-tune your message.
Why it matters: The better your targeting and creative match, the higher your engagement and lower your costs.
- Funnel Drop-Off Rates
Ever wonder where users are quitting in your sign-up or onboarding process? Funnel drop-off rates tell you exactly where you’re losing people.
Why it matters: Spotting the problem points means you can fix them—and keep more users around.
One Tool to Track Them All: Apptrove
Tracking these hidden gems doesn’t have to be a headache. Apptrove makes it easy. With real-time dashboards, powerful segmentation, and deep insights, Apptrove gives you the tools to understand what’s really going on with your UA strategy—so you can scale smarter, not harder.
Ready to make every user count? It’s time to give your metrics a major glow-up. Try Apptrove today.

Are your UA strategies missing key insights? Find out now!
Preview Text This will be used as the preview text that displays in some email clients